• Hadoop,  Hive,  Tez,  YARN

    Hive on Tez – Shuffle Failed with Too Many Fetch Failures and Insufficient Progress

    On one of the clusters I noticed an increased rate of shuffle errors, and the restart of a job did not help, it still failed with the same error.

    The error was as follows:

     Error: Error while running task ( failure ) : 
      org.apache.tez.runtime.library.common.shuffle.orderedgrouped.Shuffle$ShuffleError: 
        error in shuffle in Fetcher 
     at org.apache.tez.runtime.library.common.shuffle.orderedgrouped.Shuffle$RunShuffleCallable.callInternal
     (Shuffle.java:301)
    
    Caused by: java.io.IOException: 
      Shuffle failed with too many fetch failures and insufficient progress!failureCounts=1,
        pendingInputs=1, fetcherHealthy=false, reducerProgressedEnough=true, reducerStalled=true
    
  • Hive,  Memory,  Tez,  YARN

    Hive – Issues With Large YARN Containers – Low Concurrency and Utilization, High Execution Time

    I was asked to tune a Hive query that ran more than 10 hours. It was running on a 100 node cluster with 16 GB available for YARN containers on each node.

    Although the query processed about 2 TB of input data, it did a fairly simple aggregation on user_id column and did not look too complex. It had 1 Map stage with 1,500 tasks and 1 Reduce stage with 7,000 tasks.

    All map tasks completed within 30 minutes, and the query stuck on the Reduce phase. So what was wrong?

  • Hive,  JVM,  Tez

    Apache Hive on Tez – Quick On The Fly Profiling of Long Running Tasks Using Jstack Probes and Flame Graphs

    I was asked to diagnose and tune a long and complex ad-hoc Hive query that spent more than 4 hours on the reduce stage. The fetch from the map tasks and the merge phase completed fairly quickly (within 10 minutes) and the reducers spent most of their time iterating the input rows and performing the aggregations defined by the query – MIN, SUM, COUNT and PERCENTILE_APPROX and others on the specific columns.

    After the merge phase a Tez reducer does not output many log records to help you diagnose the performance issues and find the bottlenecks. In this article I will describe how you can profile an already running Tez task without restarting the job.

  • Hive,  Tez

    Apache Hive – Monitoring Progress of Long-Running Reducers – hive.log.every.n.records Option

    Reducer aggregates rows within input groups (i.e. rows having the same grouping key) typically producing one output row per group. For example, the following query returns ~200 rows even if the source events table has billions of rows:

    SELECT country, count(*) 
    FROM events 
    GROUP BY country;
    

    The problem is that despite the small number of output rows the aggregation still can be a very long process taking many hours.

  • Hive,  Pig,  Tez

    Apache Hive/Pig on Tez – Long Running Tasks and Their Failed Attempts – Analyzing Performance and Finding Bottlenecks (Insufficient Parallelism) using Application Master Logs

    Apache Tez is the main distributed execution engine for Apache Hive and Apache Pig jobs.

    Tez represents a data flow as DAGs (Directed acyclic graph) that consists of a set of vertices connected by edges. Vertices represent data transformations while edges represent movement of data between vertices.

    For example, the following Hive SQL query:

    SELECT u.name, sum_items 
    FROM
     (
       SELECT user_id, SUM(items) sum_items
       FROM sales
       GROUP BY user_id
     ) s
     JOIN
       users u
     ON s.user_id = u.id
    

    and its corresponding Apache Pig script:

    sales = LOAD 'sales' USING org.apache.hive.hcatalog.pig.HCatLoader();
    users = LOAD 'users' USING org.apache.hive.hcatalog.pig.HCatLoader();
    
    sales_agg = FOREACH (GROUP sales BY user_id)
      GENERATE 
        group.user_id as user_id,
        SUM(sales.items) as sum_items;
        
    data = JOIN sales_agg BY user_id, users BY id;
    

    Can be represented as the following DAG in Tez:

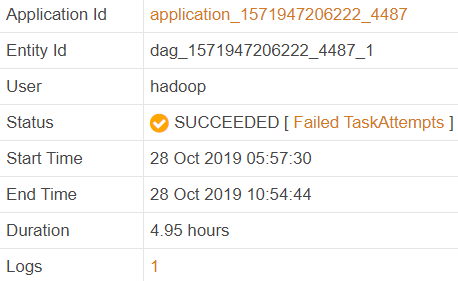
    In my case the job ran almost 5 hours:

    Why did it take so long to run the job? Is there any way to improve its performance?

  • Data Skew,  Distributed,  Pig,  Tez

    Reduce Number of Output Files for Skewed Data – ORDER in Apache Pig – Sampler and Weighted Range Partitioner to Balance Reducers

    One of our event tables is very large, it contains billions of rows per day. Since the analytics team is often interested in specific events only it makes sense to process the raw events and generate a partition for every event type. Then when a data analyst runs an ad-hoc query, it reads data for the required event type only increasing the query performance.

    The problem is that there are 3,000 map tasks are launched to read the daily data and there are 250 distinct event types, so the mappers will produce 3,000 * 250 = 750,000 files per day. That’s too much.

  • Hive,  Memory,  Tez,  YARN

    Tez Memory Tuning – Container is Running Beyond Physical Memory Limits – Solving By Reducing Memory Settings

    Can reducing the Tez memory settings help solving memory limit problems? Sometimes this paradox works.

    One day one of our Hive query failed with the following error: Container is running beyond physical memory limits. Current usage: 4.1 GB of 4 GB physical memory used; 6.0 GB of 20 GB virtual memory used. Killing container.

  • Amazon,  AWS,  EMR,  Hive,  ORC,  Tez

    Tez Internals #2 – Number of Map Tasks for Large ORC Files with Small Stripes in Amazon EMR

    Let’s see how Hive on Tez defines the number of map tasks when the input data is stored in large ORC files but having small stripes.

    Note. All experiments below were executed on Amazon Hive 2.1.1. This article does not apply to Qubole running on Amazon AWS. Qubole has a different algorithm to define the number of map tasks for ORC files.

  • Hive,  I/O,  Tez

    Tez Internals #1 – Number of Map Tasks

    Let’s see how Apache Tez defines the number of map tasks when you execute a SQL query in Hive running on the Tez engine.

    Consider the following sample SQL query on a partitioned table:

    select count(*) from events where event_dt = '2018-10-20' and event_name = 'Started';
    

    The events table is partitioned by event_dt and event_name columns, and it is quite big – it has 209,146 partitions, while the query requests data from a single partition only:

    $ hive -e "show partitions events"
    
    event_dt=2017-09-22/event_name=ClientMetrics
    event_dt=2017-09-23/event_name=ClientMetrics
    ...
    event_dt=2018-10-20/event_name=Location
    ...
    event_dt=2018-10-20/event_name=Started
    
    Time taken: 26.457 seconds, Fetched: 209146 row(s)