You use the LIMIT clause to quickly browse and review data samples, so you expect that such queries complete in less than a second. But let’s consider Spark’s LIMIT behaviour on very large data sets and what performance issues you may have.
I have an events table containing 100,000 Parquet files, and run the following queries with the LIMIT clause:
SELECT name, json
FROM events
LIMIT 10;
# 4.24 seconds runtime (1 Task executed in Spark)
Then I wanted to reveal some JSON values:
SELECT name, json, key, val
FROM
 (SELECT name, json
  FROM events) t
 LATERAL VIEW EXPLODE(from_json(json,'map<string, string>')) AS key, val
LIMIT 10;
# 4.35 seconds runtime (1 Task executed in Spark)
Then I tried to move LIMIT into the subquery:
SELECT name, json, key, val
FROM
 (SELECT name, json
  FROM events
  LIMIT 10
 ) t
 LATERAL VIEW EXPLODE(from_json(json,'map<string, string>')) AS key, val;
# 2.09 minutes runtime (2509 Tasks executed in Spark)
As you can note moving LIMIT into the subquery caused Spark to run 2,509 tasks and it took more than 2 minutes to run the query!
How Spark Runs Outer LIMIT
In the first and second queries I used outer LIMIT, both queries ran just 1 task, and the physical plan for the second query is as follows:
== Physical Plan == (Simplified)
CollectLimit 10
+- Project [name, json, key, val]
   +- Generate explode(from_json(MapType(StringType,StringType)))
      +- FileScan parquet spark_catalog.events
You can see CollectLimit as the root node, there is no any LIMIT pushdown, but why only 1 task was executed on the table that contains 100,000 files?
The reason is that Spark optimizes the execution of CollectLimit. Firstly it runs a job selecting only one RDD partition expecting that the result will contain LIMIT n output rows.
If it does not, Spark starts the second job multipliyng the number of input RDD partitions by
spark.sql.limit.scaleUpFactor configuration parameter (it is 4 by default). It continues to run subsequent jobs multiplying partitions again and again (1, 4, 16 and so on) until it reaches the desired number of LIMIT rows or all partitiones scanned.
I have simplified the algorithm a little bit – actually the number of RDD partitions for the following jobs depends whether or not any rows were already found, and how many partitions scanned to find them. You can see the details in executeTake() method of SparkPlan class.
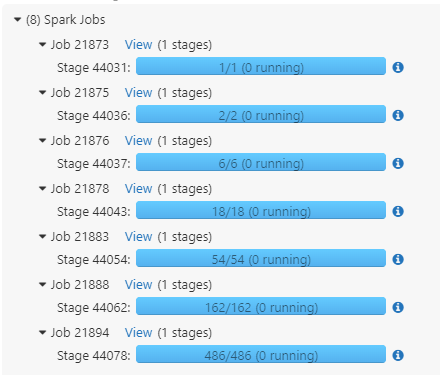
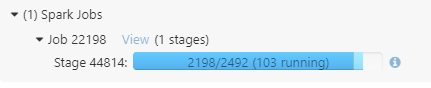
You can see this multi-job-running behaviour if you add a highly selective filter (that is rarily or almost never satisfied) to the query and run LIMIT again:
SELECT name, json
FROM events
WHERE name = 'SomeRareValue'
LIMIT 10;
Spark started multiple jobs constantly increasing the number of read partitions:
How Spark Runs LIMIT in Subquery
In the 3rd query when I moved LIMIT into subquery the performance became much worse:
SELECT name, json, key, val
FROM
 (SELECT name, json
  FROM events
  LIMIT 10
 ) t
 LATERAL VIEW EXPLODE(from_json(json,'map<string, string>')) AS key, val;
# 2.09 minutes runtime (2509 Tasks executed in Spark)
Now the physical plan is as follows:
== Physical Plan == (Simplified)
AdaptiveSparkPlan
+- Project [name, json, key, val]
   +- Generate explode(from_json(MapType(StringType,StringType)))
      +- GlobalLimit 10, 0
         +- Exchange SinglePartition, ENSURE_REQUIREMENTS
            +- LocalLimit 10
               +- FileScan parquet spark_catalog.events
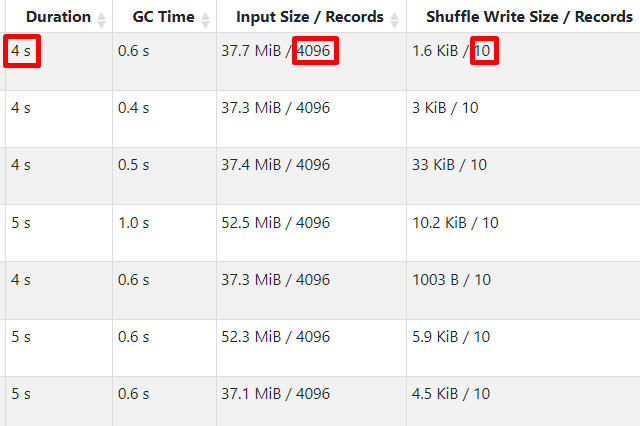
Now there are GlobalLimit-Exchange-LocalLimit nodes in the plan that means Spark will start reading all RDD partitions. It will read only LIMIT n rows from every RDD, but anyway it takes much time for large datasets having large number of files.
As input data is in Parquet format, Spark needs to read and decompress at least 1 page of data per task (not just requested 10 rows), and it takes both time and compute resources:
How to Identify and Troubleshoot LIMIT Performance Issues
If your Spark clusters run thousands of interactive or ad-hoc jobs daily you can use Spark eventlogs to monitor if your system has any issues with LIMIT execution and you can tune them thereby reducing the query latency.
There are two opposite LIMIT performance cases:
1. Spark Starts Too Many Tasks
Query: You need to quickly review the content without filters or with a very non-selective filter (i.e. almost all rows satisfy it).
In this case you should use outer LIMIT clause (not in a subquery), so Spark will be able to select rows from the first RDD partitions, and does not need to read them all.
Note: As an extravagant solution for this specific LIMIT case you can also set spark.sql.files.maxPartitionBytes to a very high value (almost equal to the table size), so Spark will assign few RDD partitions to read the data.
How to identify such LIMIT queries from eventlogs:
- Physical plan contains nodes
GlobalLimit, LocalLimitandExchange(SparkListenerSQLExecutionStartevent) - Large number of tasks are launched (
SparkListenerStageSubmittedevent)
2. Spark Starts Too Many Jobs
Query: You need to find a few rows using highly-selected filter (few rows satisfy it, so almost all data need to be read to find even LIMIT n rows).
In this case you should use LIMIT in a subquery to start as many read tasks as possible immediately. Since Spark 3.4 there is the option spark.sql.limit.initialNumPartitions to define the number of initial partitions to read for LIMIT queries.
How to identify such queries from eventlogs:
- Physical Plan starts with
CollectLimitroot node (SparkListenerSQLExecutionStartevent) - Multiple single stage jobs are launched (with increasing number of tasks 1, 2, 4, 8 etc)
- Stage contains less tasks than the number of partitions in RDD (see
SparkListenerJobStartevent,Number of TasksandNumber of Partitionsvalues)