I had a SQL query that failed on one of the Presto 0.208 clusters with the “Query exceeded per-node total memory” (com.facebook.presto.ExceededMemoryLimitException) error. How can you solve this problem? I will consider a few possible solutions, but firstly let’s review the memory allocation in Presto.
-
-
Apache Hive on Tez – Quick On The Fly Profiling of Long Running Tasks Using Jstack Probes and Flame Graphs
I was asked to diagnose and tune a long and complex ad-hoc Hive query that spent more than 4 hours on the reduce stage. The fetch from the map tasks and the merge phase completed fairly quickly (within 10 minutes) and the reducers spent most of their time iterating the input rows and performing the aggregations defined by the query – MIN, SUM, COUNT and PERCENTILE_APPROX and others on the specific columns.
After the merge phase a Tez reducer does not output many log records to help you diagnose the performance issues and find the bottlenecks. In this article I will describe how you can profile an already running Tez task without restarting the job.
-
Apache Hive – Monitoring Progress of Long-Running Reducers – hive.log.every.n.records Option
Reducer aggregates rows within input groups (i.e. rows having the same grouping key) typically producing one output row per group. For example, the following query returns ~200 rows even if the source
eventstable has billions of rows:SELECT country, count(*) FROM events GROUP BY country;
The problem is that despite the small number of output rows the aggregation still can be a very long process taking many hours.
-
Apache Hive/Pig on Tez – Long Running Tasks and Their Failed Attempts – Analyzing Performance and Finding Bottlenecks (Insufficient Parallelism) using Application Master Logs
Apache Tez is the main distributed execution engine for Apache Hive and Apache Pig jobs.
Tez represents a data flow as DAGs (Directed acyclic graph) that consists of a set of vertices connected by edges. Vertices represent data transformations while edges represent movement of data between vertices.
For example, the following Hive SQL query:
SELECT u.name, sum_items
FROM
 (
   SELECT user_id, SUM(items) sum_items
   FROM sales
   GROUP BY user_id
 ) s
 JOIN
   users u
 ON s.user_id = u.id
and its corresponding Apache Pig script:
sales = LOAD 'sales' USING org.apache.hive.hcatalog.pig.HCatLoader();
users = LOAD 'users' USING org.apache.hive.hcatalog.pig.HCatLoader();

sales_agg = FOREACH (GROUP sales BY user_id)
  GENERATE
    group.user_id as user_id,
    SUM(sales.items) as sum_items;

data = JOIN sales_agg BY user_id, users BY id;
Can be represented as the following DAG in Tez:

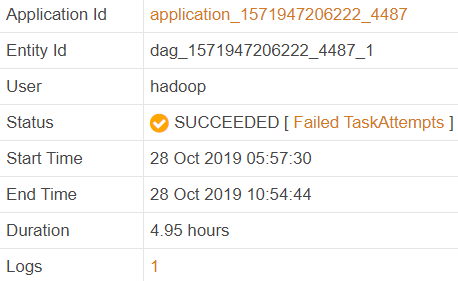
In my case the job ran almost 5 hours:

Why did it take so long to run the job? Is there any way to improve its performance?
-
Sqoop Import from Amazon RDS Read Replica – ERROR: Canceling Statement due to Conflict with Recovery
Apache Sqoop is widely used to import data from relational databases into cloud. One of our databases uses Amazon RDS for PostgreSQL to store sales data and its Sqoop import periodically failed with the following error:
Error: java.io.IOException: SQLException in nextKeyValue
Caused by: org.postgresql.util.PSQLException: ERROR: canceling statement due to conflict with recovery
  Detail: User query might have needed to see row versions that must be removed.
In this article I will describe a solution that helped resolve the problem in our specific case.
-
Hadoop YARN – Calculating Per Second Utilization of Cluster using Resource Manager Logs
You can use YARN REST API to collect various Hadoop cluster metrics such as available and allocated memory, CPU, containers and so on.
If you set up a process to extract data from this API once per minute e.g. you can very easily collect and analyze historical and current cluster utilization quite accurately. For more details, see Collecting Utilization Metrics from Multiple Clusters article.
But even if you query YARN REST API every second it still can only provide a snapshot of the used YARN resources. It does not show which application allocates or releases containers, their memory and CPU capacity, in which order these events occur, what is their exact timestamp and so on.
For this reason I prefer a different approach that is based on using the YARN Resource Manager logs to calculate the exact per second utilization metrics of a Hadoop cluster.
-
Tuning Hadoop YARN – Boosting Memory Settings Beyond the Limits to Increase Cluster Capacity and Utilization
Memory allocation in Hadoop YARN clusters has some drawbacks that may lead to significant cluster under-utilization and at the same time (!) to large queues of pending applications.
So you have to pay for extra compute resources that you do not use and still have unsatisfied users. Let’s see how this can happen and how you can mitigate this.
-
Amazon EMR – Downscaling and Ghost (Impaired) Nodes
I already wrote about recovering the ghost nodes in Amazon EMR clusters, but in this article I am going to extend this information for EMR clusters configured for auto-scaling.
-
Amazon EMR – Recovering Ghost Nodes
In a Hadoop cluster besides Active nodes you may also have Unhealthy, Lost and Decommissioned nodes. Unhealthy nodes are running but just excluded from scheduling the tasks because they, for example, do not have enough disk space. Lost nodes are nodes that are not reachable anymore. The decommissioned nodes are nodes that successfully terminated and left the cluster.
But all these nodes are known to the Hadoop YARN cluster and you can see their details such as IP addresses, last health updates and so on.
At the same time there can be also Ghost nodes i.e. nodes that are running by Amazon EMR services but Hadoop itself does not know anything about their existence. Let’s see how you can find them.
-
Amazon EMR – Recovering Unhealthy Nodes with EMR Services Down
Usually Hadoop is able to automatically recover cluster nodes from Unhealthy state by cleaning log and temporary directories. But sometimes nodes stay unhealthy for a long time and manual intervention is necessary to bring them back.