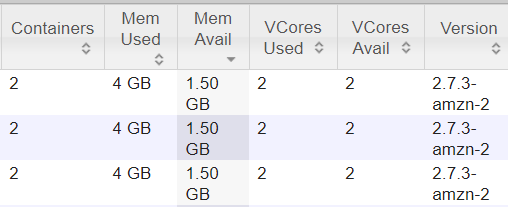
Analyzing a Hadoop cluster I noticed that it runs 2 GB and 4 GB containers only, and does not allocate the entire available memory to applications always leaving about 150 GB of free memory.
The clusters run Apache Pig and Hive applications, and the default settings (they are also inherited by Tez engine used by Pig and Hive):
-- from mapred-site.xml
mapreduce.map.memory.mb            1408
mapreduce.reduce.memory.mb         2816
yarn.app.mapreduce.am.resource.mb  2816
From application log, I can see the Tez job requests 1408 MB and 2816 MB of memory for Map and Reduce vertices:
INFO tez.TezDagBuilder: For vertex - scope-72: parallelism=3217, memory=1408
INFO tez.TezDagBuilder: For vertex - scope-93: parallelism=1000, memory=2816
So why does the YARN still allocate 2 GB and 4 GB containers for this job?

The reason is that this cluster has yarn.scheduler.minimum-allocation-mb option set to 2048 in yarn-site.xml. That’s why YARN ResourceManager allocates memory to containers in increments of yarn.scheduler.minimum-allocation-mb, not the requested size.
Ok, actually it is quite typical to run 2 and 4 GB containers in YARN applications, and this leads us to another problem found in this cluster: memory under-utilization.
If you look at the picture above, you can notice that each node has just 1.5 GB of memory left after allocating 2 containers. But this means that YARN cannot allocate more 2 GB containers on these nodes.
In my case, the cluster was an Amazon EMR cluster running 100 c4.xlarge EC2 instances that have 7.5 GB of memory, but only 5.5 GB is available for YARN containers:

As a result 1.5 GB * 100 = 150 GB of memory are never allocated to YARN containers.
Such cluster can be fine if you need to run 1 GB containers, but for applications that require larger containers you can use compute nodes with more memory to ensure better memory utilization.