On one of my clusters I got my favorite YARN error, although now it was in a Flink application:
Container is running beyond physical memory limits. Current usage: 99.5 GB of 99.5 GB physical memory used; 105.1 GB of 227.8 GB virtual memory used. Killing container.
Why did the container take so much physical memory and fail? Let’s investigate in detail.
YARN Container Size
When you run a Flink application on YARN, the two major memory options are: taskmanager.heap.size and containerized.heap-cutoff-ratio. In my cluster they were set as follows:
taskmanager.heap.size: 102400m
containerized.heap-cutoff-ratio: 0.1
Note that although taskmanager.heap.size has the word ‘heap’ in its name, it has nothing with the JVM heap size. Instead, taskmanager.heap.size defines the size of the container requested from YARN.
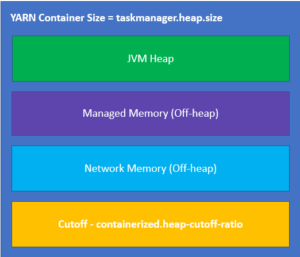
Although we requested a 102400m container, the following equation defines how much memory will be actually available for the application:
total memory = taskmanager.heap.size * (1 - containerized.heap-cutoff-ratio) = 102400m * 0.9 = 92160m
The cutoff allows reserving some memory for the JVM overhead (thread stacks, GC, code and so on). So the total memory available for the Flink application is 92160m.
Network Memory
The network buffers are taken from the JVM off-heap memory and my cluster has the following setting in flink-conf.yaml:
taskmanager.network.memory.max: 4gb
So up to 4 GB is allocated for the network buffers.
Managed Memory
The managed memory is used for batch jobs and it had the following settings in my cluster:
taskmanager.memory.fraction: 0.4
taskmanager.memory.off-heap: true
taskmanager.memory.preallocate: true
So its size is calculated as follows:
managed memory = (total memory - network memory) * taskmanager.memory.fraction =
  (92160m - 4096m) * 0.4 = 35225m
JVM Heap Size
Now we can define how much memory is allocated for the JVM heap. It is calculated as follows:
JVM heap = total memory - managed memory - network memory = 92160m - 4096m - 35225m = 52839m
So the major areas of Flink application memory:

You can view these memory settings in the Flink UI:
![]()
Physical Memory Usage
So why does the container fails with the memory error? Note the options used to run JVM:
$ jps -v
18834 YarnTaskExecutorRunner -Xms52838m -Xmx52838m -XX:MaxDirectMemorySize=49562m -XX:+UseG1GC ...
You can see that Flink claimed all heap from the beginning (-Xms option is equal to -Xmx).
Let’s view the JVM heap usage:
$ jmap -heap 18834

Garbage-First (G1) GC with 13 thread(s)

Heap Usage:
G1 Heap:
   regions  = 3303
   capacity = 55415144448 (52848.0MB)
   used     = 29174477504 (27822.94989013672MB)
   free     = 26240666944 (25025.05010986328MB)
   52.6471198345003% used
...
Now let’s check the physical memory consumption (RES) by the JVM process:
$ top -p 18834

PID   USER  PR  NI  VIRT   RES    SHR    S   %CPU   %MEM   TIME+      COMMAND
18834 yarn  20  0   99.6g  97.1g  48664  S   694.0  78.1   596:25.97  java
Above you can see that 97.1g of the physical memory was already used though the JVM heap is just 52g.
Let’s review the largest memory areas in more detail:
$ jcmd 18834 VM.native_memory summary

Total: reserved=103154117KB, committed=102875285KB

  Java Heap (reserved=54116352KB, committed=54116352KB)

  Thread (reserved=512948KB, committed=512948KB)
             (thread #498)
             (stack: reserved=510732KB, committed=510732KB)

  GC (reserved=2151519KB, committed=2151519KB)

  Internal (reserved=45822033KB, committed=45822033KB)
...
The JVM process runs about 500 threads and each thread requires 1 MB of memory for the stack. Also you can see that G1 Garbage Collector takes 2 GB of memory for its needs.
But the most interesting area is denoted as Internal and it takes 45 GB! This is the area occupied by Direct memory buffers.
Remember that my Flink application was running with options taskmanager.memory.preallocate: true and -XX:MaxDirectMemorySize=49562m
You can see Direct Memory usage in the Flink UI (looks like it does not include Network buffers of 4g):

As you can see the physical memory usage of the JVM process is quite close to the size of the YARN container size, mostly because of direct memory buffers and even a small spike in memory consumption can force YARN to kill the container of a Flink Task Manager causing the full restart of the entire Flink application from the last checkpoint.
Flink and -XX:MaxDirectMemorySize
Flink uses the following equation to define the size of -XX:MaxDirectMemorySize by default:
 -XX:MaxDirectMemorySize = cutoff + network memory + managed memory =
    taskmanager.heap.size * containerized.heap-cutoff-ratio + network memory + managed memory =
    10240m + 4096m + 35225m = 49561m
Solutions
There are a few possible solutions to solve Container is running beyond physical memory limits errors:
1. Set yarn.nodemanager.pmem-check-enabled to false in yarn-site.xml.
Actually it is not so bad to prevent YARN from checking your containers once they allocated and launched. There are -Xmx, -XX:MaxDirectMemorySize and other limits that can do their job really well.
In my case having 99.5 GB process on a node with 128 GB RAM is acceptable, no need to kill the process if it makes 1 GB more.
2. Change the way how -XX:MaxDirectMemorySize is defined, see TM_MAX_OFFHEAP_SIZE in flink/bin/taskmanager.sh
3. Do not preallocate managed memory, and set taskmanager.memory.preallocate: false
This helped a lot to reduce this physical memory usage from 97.1g to 33.9g:
PID    USER  PR   NI  VIRT    RES    SHR    S   %CPU   %MEM   TIME+     COMMAND
15534  yarn  20   0   61.3g   33.9g  48656  S   528.0  27.3   23:41.89  java
Flink UI also shows the reduction of the Direct memory usage from 40.9g to 5.5g:
