Snowflake uses a cloud storage service such as Amazon S3 as permanent storage for data (Remote Disk in terms of Snowflake), but it can also use Local Disk (SSD) to temporarily cache data used by SQL queries. Let’s test Remote and Local I/O performance by executing a sample SQL query multiple times on X-Large and Medium size Snowflake warehouses:
SELECT MIN(event_hour), MAX(event_hour) FROM events WHERE event_name = 'LOGIN';
Note that you should disable the Result Cache for queries in your session to perform such tests, otherwise Snowflake will just return the cached result immediately after the first attempt:
alter session set USE_CACHED_RESULT = FALSE;
X-Large Cluster (16 Compute Nodes)
I executed the sample query 7 times and got the following results (first run is last):

In Bytes Scanned column, color means the size fraction of Remote Disk reads (in my case this is Amazon S3), while color means the size fraction of Memory/Local Disk Cache reads.
You can notice that Snowflake put more data into the Local Cache with each subsequent run, but this depends on the warehouse load. For example, when I executed the same query next day, Snowflake read all data from cache for the second attempt:

Here is more details from the query profile for the initial 7 attempts:
| # | Execution Time | Bytes Scanned | Remote | Local |
|---|---|---|---|---|
| 1 | 7m 48s | 121.7 GB | 121.4 GB | 269.9 MB |
| 2 | 3m 29s | 81.5 GB | 52.2 GB | 29.3 GB |
| 3 | 2m 1s | 70.3 GB | 32.5 GB | 37.8 GB |
| 4 | 1m 1s | 59.9 GB | 14.5 GB | 45.4 GB |
| 5 | 33.5s | 56.0 GB | 7.9 GB | 48.1 GB |
| 6 | 27.5s | 55.2 GB | 6.6 GB | 48.6 GB |
| 7 | 29.2s | 55.4 GB | 6.9 GB | 48.5 GB |
Note that Snowflake is able to store data in Local Cache in more compact form compared with the compressed data read from the Remote storage (Amazon S3). Initially it read 121.7 GB, then 81.5 GB, and finally it needed to read only 55.4 GB when most of data was in the Local Cache.
Additionally, we can get the percentage of time taken by Remote Disk I/O, Local Disk I/O and Processing (CPU) within TableScan stage that we can use to estimate the transfer rates:
| # | TableScan | Remote I/O | Local I/O | Processing | Remote Transfer Rate |
|---|---|---|---|---|---|
| 1 | 99% | 99% | 0% | 0% | 265.0 MB/s |
| 2 | 97.8% | 99% | 0% | 1% | 258.4 MB/s |
| 3 | 95.3% | 98% | 0% | 2% | 288.3 MB/s |
| 4 | 86.5% | 94% | 0% | 5% | 292.3 MB/s |
| 5 | 76% | 89% | 0% | 9% | 348.0 MB/s |
| 6 | 67.9% | 84% | 1% | 14% | 420.3 MB/s |
| 7 | 67.5% | 84% | 1% | 15% | 431.2 MB/s |
From this report you can see that Remote I/O is quite expensive operation: even when we needed to read 6.9 GB data from S3 (it is 12.4% of all data scanned), it took 84% of time of the TableScan stage.
As about Amazon S3, we can see that X-Large cluster can read data with ~265.0 MB/s transfer rate (for large data transfers). So X-Large cluster needs 63 minutes to read 1 TB from S3.
Medium Cluster (4 Compute Nodes)
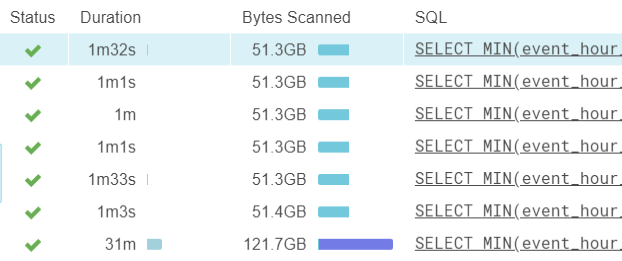
Next, I executed the same query 7 times on the Medium cluster (first run is last):

You can see that this time Snowflake put almost all data to Local Cache after the first attempt. Below are more details from the query profile:
| # | Execution Time | Bytes Scanned | Remote | Local |
|---|---|---|---|---|
| 1 | 31m | 121.7 GB | 121.5 GB | 242.1 MB |
| 2 | 1m 3s | 51.4 GB | 136.3 MB | 51.2 GB |
| 3 | 1m 33s | 51.3 GB | 82.6 MB | 51.3 GB |
| 4 | 1m 1s | 51.3 GB | 79.3 MB | 51.3 GB |
| 5 | 1m | 51.3 GB | 32.1 MB | 51.3 GB |
| 6 | 1m 1s | 51.3 GB | 45.9 MB | 51.3 GB |
| 7 | 1m 32s | 51.3 GB | 62.0 MB | 51.3 GB |
Again, we can get percentage of time taken by Remote Disk I/O, Local Disk I/O and Processing (CPU) within the TableScan stage:
| # | TableScan | Remote I/O | Local I/O | Processing | Remote Rate | Local Rate |
|---|---|---|---|---|---|---|
| 1 | 99.2% | 99% | 0% | 0% | 66.5 MB/s | – |
| 2 | 39.2% | 18% | 40% | 41% | 31.0 MB/s | 5.2 GB/s |
| 3 | 42.7% | 4% | 29% | 66% | 51.6 MB/s | 4.5 GB/s |
| 4 | 36.3% | 7% | 46% | 46% | 52.9 MB/s | 5.0 GB/s |
| 5 | 36.9% | 6% | 47% | 47% | 24.7 MB/s | 5.0 GB/s |
| 6 | 36% | 7% | 48% | 45% | 30.6 MB/s | 4.8 GB/s |
| 7 | 57% | 2% | 62% | 36% | 62.0 MB/s | 1.6 GB/s |
You can see how fast is the Local Cache compared with the Remote Disk (~75x times faster).
Medium cluster can read data with ~66.5 MB/s transfer rate (for large data transfers), so it needs 4 hours 10 minutes to read 1 TB from S3. It is 4x more time than X-Large cluster that has 4x more power.
Local Disk Cache Capacity
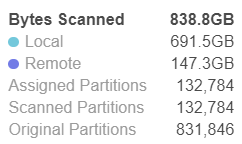
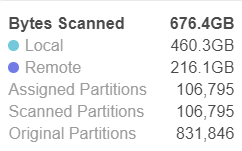
Snowflake does not disclose how much memory is available for Local Disk cache, and I tried to run a heavy SQL query over and over again to estimate the cache size, and the maximum I could see is ~700 GB for X-Large cluster (~45 GB per node):

and ~460 GB for Medium cluster (~115 GB per node):

It is unlikely that the cache size per node for Medium is larger than for X-Large, so probably Snowflake can allocate more cache for X-Large that I was able to get in my experiments.