Apache Tez is the main distributed execution engine for Apache Hive and Apache Pig jobs.
Tez represents a data flow as DAGs (Directed acyclic graph) that consists of a set of vertices connected by edges. Vertices represent data transformations while edges represent movement of data between vertices.
For example, the following Hive SQL query:
SELECT u.name, sum_items
FROM
 (
   SELECT user_id, SUM(items) sum_items
   FROM sales
   GROUP BY user_id
 ) s
 JOIN
   users u
 ON s.user_id = u.id
and its corresponding Apache Pig script:
sales = LOAD 'sales' USING org.apache.hive.hcatalog.pig.HCatLoader();
users = LOAD 'users' USING org.apache.hive.hcatalog.pig.HCatLoader();

sales_agg = FOREACH (GROUP sales BY user_id)
  GENERATE
    group.user_id as user_id,
    SUM(sales.items) as sum_items;

data = JOIN sales_agg BY user_id, users BY id;
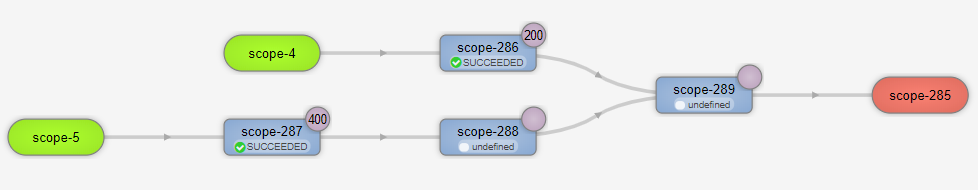
Can be represented as the following DAG in Tez:
In my case the job ran almost 5 hours:
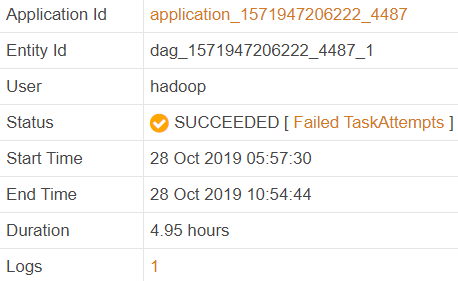
Why did it take so long to run the job? Is there any way to improve its performance?
Tez Application Master Log
I am going to use the Tez AM log to investigate vertex performance and find possible bottlenecks.
Note that there is the Timeline Server REST API that you can use to get the statistics for Tez jobs, but the application master log is “event-driven”, shows the exact order of all events and contains much more details in general.
Since a single AM can run multiple DAGs in one session let’s find the beginning of our job:
2019-10-28 02:57:30,590 [INFO] |app.DAGAppMaster|: Running DAG
2019-10-28 02:57:30,831 [INFO] |history.HistoryEventHandler|: [HISTORY][DAG:dag_1571947206222_4487_1]
[Event:DAG_SUBMITTED]
Tez is ready to run vertices (but it is not physical execution yet):
2019-10-28 02:57:30,864 [INFO] |impl.VertexImpl|: Running vertex: vertex_1571947206222_4487_1_00
 [scope-286]

2019-10-28 02:57:30,866 [INFO] |impl.VertexImpl|: Running vertex: vertex_1571947206222_4487_1_01
 [scope-287]

2019-10-28 02:57:30,869 [INFO] |impl.VertexImpl|: Running vertex: vertex_1571947206222_4487_1_02
 [scope-288]

2019-10-28 02:57:30,870 [INFO] |impl.VertexImpl|: Running vertex: vertex_1571947206222_4487_1_03
 [scope-289]
Tez creates tasks to read data from 2 data sources (tables sales and users in my case), tasks for GROUP BY and tasks for JOIN:
2019-10-28 02:57:30,890 [INFO] |impl.VertexImpl|: Creating 200 tasks for vertex:
  vertex_1571947206222_4487_1_00 [scope-286]

2019-10-28 02:57:30,918 [INFO] |impl.VertexImpl|: Creating 400 tasks for vertex:
  vertex_1571947206222_4487_1_01 [scope-287]

2019-10-28 02:57:30,935 [INFO] |impl.VertexImpl|: Creating 200 tasks for vertex:
  vertex_1571947206222_4487_1_02 [scope-288]

2019-10-28 02:57:30,944 [INFO] |impl.VertexImpl|: Creating 200 tasks for vertex:
  vertex_1571947206222_4487_1_03 [scope-289]
Then Tez starts the tasks (again, it is not physical execution yet):
2019-10-28 02:57:32,660 [INFO] |history.HistoryEventHandler|:
  [Event:TASK_STARTED]: vertexName=scope-287, taskId=task_1571947206222_4487_1_01_000000

2019-10-28 02:57:32,698 [INFO] |history.HistoryEventHandler|:
  [Event:TASK_STARTED]: vertexName=scope-286, taskId=task_1571947206222_4487_1_00_000000

2019-10-28 02:57:32,712 [INFO] |history.HistoryEventHandler|:
  [Event:TASK_STARTED]: vertexName=scope-287, taskId=task_1571947206222_4487_1_01_000001
...
Note that tasks for different vertices can run concurrently. TASK_STARTED event is just the “logical” start of the task, and YARN containers are not allocated yet to physically run them on the compute nodes of the cluster.
Since there are a lot of tasks, I ran a script to parse and collect some stats for the TASK_STARTED events:
Tasks Started:

scope-286: 200 tasks
  Minimum timestamp: 2019-10-28 02:57:32,698
  Maximum timestamp: 2019-10-28 02:57:32,741

scope-287: 400 tasks
  Minimum timestamp: 2019-10-28 02:57:32,660
  Maximum timestamp: 2019-10-28 02:57:32,750

scope-288: 200 tasks
  Minimum timestamp: 2019-10-28 02:59:55,443
  Maximum timestamp: 2019-10-28 02:59:58,895

scope-289: 200 tasks
  Minimum timestamp: 2019-10-28 03:56:49,739
  Maximum timestamp: 2019-10-28 04:00:57,249
You can see all scope-286 and scope-287 tasks were started immediately.
As the next step Tez tries to allocate resources to run the tasks:
2019-10-28 02:57:32,791 [INFO] |rm.YarnTaskSchedulerService|: Allocation request for task:
  attempt_1571947206222_4487_1_01_000000_0 with request: Capability[<memory:1479, vCores:1>]

2019-10-28 02:57:32,791 [INFO] |rm.YarnTaskSchedulerService|: Allocation request for task:
  attempt_1571947206222_4487_1_00_000000_0 with request: Capability[<memory:1479, vCores:1>]

2019-10-28 02:57:32,791 [INFO] |rm.YarnTaskSchedulerService|: Allocation request for task:
  attempt_1571947206222_4487_1_01_000001_0 with request: Capability[<memory:1479, vCores:1>]
...
Parsing the allocation request events I was able to collect the following stats:
Allocation Requests:

vertex_1571947206222_4487_1_00: 200 requests
  Minimum timestamp: 2019-10-28 02:57:32,791
  Maximum timestamp: 2019-10-28 02:57:32,822

vertex_1571947206222_4487_1_01: 400 requests
  Minimum timestamp: 2019-10-28 02:57:32,791
  Maximum timestamp: 2019-10-28 02:57:32,831

vertex_1571947206222_4487_1_02: 205 requests
  Minimum timestamp: 2019-10-28 02:59:55,462
  Maximum timestamp: 2019-10-28 03:09:42,694

vertex_1571947206222_4487_1_03: 240 requests
  Minimum timestamp: 2019-10-28 03:56:49,755
  Maximum timestamp: 2019-10-28 06:15:46,143
After the Tez application master receives containers from YARN, you can see the following messages:
2019-10-28 02:57:34,676 [INFO] |rm.YarnTaskSchedulerService|: Assigning container to task:
  containerId=container_1571947206222_4487_01_000002, task=attempt_1571947206222_4487_1_00_000000_0,
  containerHost=ip-10-84-55-173.ec2.internal:8041, containerResources=<memory:1504, vCores:1>

2019-10-28 02:57:34,677 [INFO] |rm.YarnTaskSchedulerService|: Assigning container to task:
  containerId=container_1571947206222_4487_01_000032, task=attempt_1571947206222_4487_1_00_000001_0,
  containerHost=ip-10-84-55-226.ec2.internal:8041, containerResources=<memory:1504, vCores:1>

2019-10-28 02:57:34,678 [INFO] |rm.YarnTaskSchedulerService|: Assigning container to task:
  containerId=container_1571947206222_4487_01_000017, task=attempt_1571947206222_4487_1_00_000002_0,
  containerHost=ip-10-84-55-209.ec2.internal:8041, containerResources=<memory:1504, vCores:1>
...
Summary on the assigned container events:
Assigned Containers:

vertex_1571947206222_4487_1_00: 200 containers
  Minimum timestamp: 2019-10-28 02:57:34,676
  Maximum timestamp: 2019-10-28 02:57:34,706

vertex_1571947206222_4487_1_01: 400 containers
  Minimum timestamp: 2019-10-28 02:57:34,706
  Maximum timestamp: 2019-10-28 02:57:36,347

vertex_1571947206222_4487_1_02: 205 containers
  Minimum timestamp: 2019-10-28 02:59:57,349
  Maximum timestamp: 2019-10-28 03:09:44,187

vertex_1571947206222_4487_1_03: 240 containers
  Minimum timestamp: 2019-10-28 03:56:50,820
  Maximum timestamp: 2019-10-28 06:15:47,634
Tez spends some time to launch the containers and you can see the following message when a task actually starts:
2019-10-28 02:57:35,951 [INFO] |history.HistoryEventHandler|: [HISTORY][DAG:dag_1571947206222_4487_1]
 [Event:TASK_ATTEMPT_STARTED]: vertexName=scope-287,
 taskAttemptId=attempt_1571947206222_4487_1_01_000039_0,
 containerId=container_1571947206222_4487_01_000225, nodeId=ip-10-84-55-197.ec2.internal:8041
...
Summary on the attempt start events:
Task Attempts Started:

scope-286: 200 attempts
  Minimum timestamp: 2019-10-28 02:57:36,533
  Maximum timestamp: 2019-10-28 02:57:38,235

scope-287: 400 attempts
  Minimum timestamp: 2019-10-28 02:57:35,951
  Maximum timestamp: 2019-10-28 02:57:38,287

scope-288: 205 attempts
  Minimum timestamp: 2019-10-28 02:59:58,272
  Maximum timestamp: 2019-10-28 03:09:45,134

scope-289: 240 attempts
  Minimum timestamp: 2019-10-28 03:56:51,791
  Maximum timestamp: 2019-10-28 06:15:48,567
When a task attempt finished the following event shows its execution statistics:
2019-10-28 02:59:51,587 [INFO] |history.HistoryEventHandler|: [HISTORY][DAG:dag_1571947206222_4487_1]
  [Event:TASK_FINISHED]: vertexName=scope-287, taskId=task_1571947206222_4487_1_01_000003,
  startTime=1572231457104, finishTime=1572231591585, timeTaken=134481, status=SUCCEEDED,
  successfulAttemptID=attempt_1571947206222_4487_1_01_000003_0,
  FILE_BYTES_READ=894396137, FILE_BYTES_WRITTEN=1667278775, S3N_BYTES_READ=531118188,
  INPUT_RECORDS_PROCESSED=12899158, INPUT_SPLIT_LENGTH_BYTES=531118188, OUTPUT_RECORDS=12899158,
  OUTPUT_BYTES=2119682165, OUTPUT_BYTES_WITH_OVERHEAD=2024479834, OUTPUT_BYTES_PHYSICAL=833233007
...
Summary for the finished tasks:
Tasks Finished:

scope-286: 200 tasks
  Minimum timestamp: 2019-10-28 03:54:00,943
  Maximum timestamp: 2019-10-28 04:16:05,362

scope-287: 400 tasks
  Minimum timestamp: 2019-10-28 02:59:51,587
  Maximum timestamp: 2019-10-28 03:00:14,312

scope-288: 200 tasks
  Minimum timestamp: 2019-10-28 03:08:35,733
  Maximum timestamp: 2019-10-28 03:10:33,184

scope-289: 200 tasks
  Minimum timestamp: 2019-10-28 06:01:53,947
  Maximum timestamp: 2019-10-28 07:54:44,148
You can notice that there are about 2 hours between the first and last finished task in scope-289 (JOIN operation) and 20 minutes in scope-286 (GROUP BY operation).
Below you can see an approximate timeline of execution for each vertex:
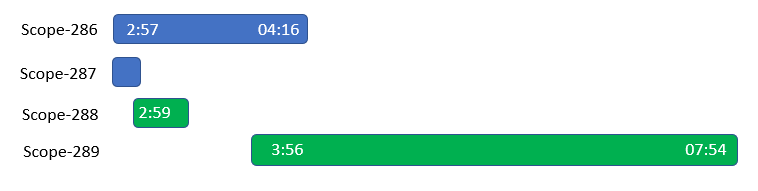
The final JOIN (scope-289) starts when the first task of scope-286 finishes (not all), but it still has to wait an hour to start.
Tasks Execution Time
Next, it makes sense to analyze the execution time (minimum, maximum and percentiles) for tasks to find skews or anomalies:
scope-286:
  Minimum: 3383.5 sec (56.3 min)
  Maximum: 4707.5 sec (78.4 min)
  p01: 3402.0 sec (56.7 min)
  p05: 3452.6 sec (57.5 min)
  p25: 3551.9 sec (59.1 min)
  p50: 3676.9 sec (61.2 min)
  p75: 3799.6 sec (63.3 min)
  p95: 3957.2 sec (65.9 min)
  p99: 4546.4 sec (75.7 min)

scope-287:
  Minimum: 134.4 sec (2.2 min)
  Maximum: 156.7 sec (2.6 min)
  p01: 135.1 sec (2.2 min)
  p05: 136.4 sec (2.2 min)
  p25: 137.8 sec (2.2 min)
  p50: 139.5 sec (2.3 min)
  p75: 141.5 sec (2.3 min)
  p95: 144.3 sec (2.4 min)
  p99: 148.0 sec (2.4 min)

scope-288:
  Minimum: 516.7 sec (8.6 min)
  Maximum: 633.3 sec (10.5 min)
  p01: 517.4 sec (8.6 min)
  p05: 523.7 sec (8.7 min)
  p25: 531.9 sec (8.8 min)
  p50: 538.6 sec (8.9 min)
  p75: 545.0 sec (9.0 min)
  p95: 556.1 sec (9.2 min)
  p99: 564.5 sec (9.4 min)

scope-289:
  Minimum: 7388.2 sec (123.1 min)
  Maximum: 14064.9 sec (234.4 min)
  p01: 7465.0 sec (124.4 min)
  p05: 7617.8 sec (126.9 min)
  p25: 7823.5 sec (130.3 min)
  p50: 7935.8 sec (132.2 min)
  p75: 8036.4 sec (133.9 min)
  p95: 8192.3 sec (136.5 min)
  p99: 8433.8 sec (140.5 min)
Long Running Map Tasks
scope-286 and scope-287 are map tasks that read the input data. While scope-287 looks good (2 minutes per task without significant variance) scope-286 tasks run from 56 to 78 minutes that is quite long for mappers.
Why is long running task a problem?
- If a 1-hour task fails (failure is normal) you need one more hour to restart it that significantly delays the downstream data pipeline and just adds 1 hour to the job execution time (!)
- When the cluster has enough resources it can parallelize the processing at the task level but this is not possible when tasks are large (task is an atomic unit of work and cannot be split into smaller chunks).
First let’s see the input size for map tasks:
scope-286:
  Total inputSplitSize: 1007598.6 MB (1007.5 GB)
  Minimum inputSplitSize: 5008.3 MB (5.0 GB)
  Maximum inputSplitSize: 5071.6 MB (5.0 GB)
  p01 inputSplitSize: 5016.9 MB (5.0 GB)
  p05 inputSplitSize: 5022.0 MB (5.0 GB)
  p25 inputSplitSize: 5031.0 MB (5.0 GB)
  p50 inputSplitSize: 5038.0 MB (5.0 GB)
  p75 inputSplitSize: 5044.3 MB (5.0 GB)
  p95 inputSplitSize: 5054.1 MB (5.0 GB)
  p99 inputSplitSize: 5064.6 MB (5.0 GB)

scope-287:
  Total inputSplitSize: 212296.8 MB (212.2 GB)
  Minimum inputSplitSize: 530.3 MB (0.5 GB)
  Maximum inputSplitSize: 531.1 MB (0.5 GB)
  p01 inputSplitSize: 530.4 MB (0.5 GB)
  p05 inputSplitSize: 530.5 MB (0.5 GB)
  p25 inputSplitSize: 530.6 MB (0.5 GB)
  p50 inputSplitSize: 530.7 MB (0.5 GB)
  p75 inputSplitSize: 530.8 MB (0.5 GB)
  p95 inputSplitSize: 531.0 MB (0.5 GB)
  p99 inputSplitSize: 531.1 MB (0.5 GB)
Input processing rate:
scope-286: 200 tasks
  Total inputSplitSize: 1007598.6 MB (1007.5 GB)
  Minimum start time: 2019-10-28 02:57:36,533
  Maximum end time: 2019-10-28 04:16:05,362
  Duration: 4708.8 sec (78.4 min)
  Total inputSplitSize/sec: 213.9 MB/sec
  Minimum inputSplitSize/sec: 1.0 MB/sec
  Maximum inputSplitSize/sec: 1.4 MB/sec
  p01 inputSplitSize/sec: 1.1 MB/sec
  p05 inputSplitSize/sec: 1.2 MB/sec
  p25 inputSplitSize/sec: 1.3 MB/sec
  p50 inputSplitSize/sec: 1.3 MB/sec
  p75 inputSplitSize/sec: 1.4 MB/sec
  p95 inputSplitSize/sec: 1.4 MB/sec
  p99 inputSplitSize/sec: 1.4 MB/sec

scope-287: 400 tasks
  Total inputSplitSize: 212296.8 MB (212.2 GB)
  Minimum start time: 2019-10-28 02:57:35,951
  Maximum end time: 2019-10-28 03:00:14,312
  Duration: 158.3 sec (2.6 min)
  Total inputSplitSize/sec: 1340.5 MB/sec
  Minimum inputSplitSize/sec: 3.3 MB/sec
  Maximum inputSplitSize/sec: 3.9 MB/sec
  p01 inputSplitSize/sec: 3.5 MB/sec
  p05 inputSplitSize/sec: 3.6 MB/sec
  p25 inputSplitSize/sec: 3.7 MB/sec
  p50 inputSplitSize/sec: 3.8 MB/sec
  p75 inputSplitSize/sec: 3.8 MB/sec
  p95 inputSplitSize/sec: 3.8 MB/sec
  p99 inputSplitSize/sec: 3.9 MB/sec
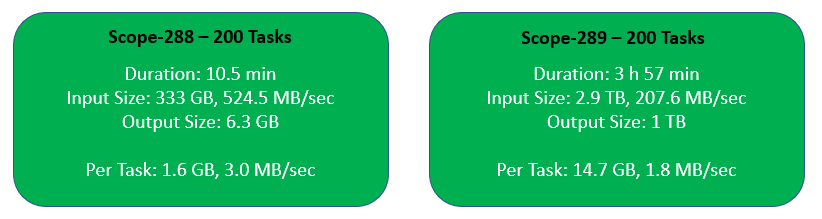
Output size for map tasks:
scope-286: 200 tasks
  Total outputSize: 2956830.1 MB (2956.8 GB)
  Minimum outputSize: 14697.9 MB (14.6 GB)
  Maximum outputSize: 14883.0 MB (14.8 GB)
  p01 outputSize: 14720.4 MB (14.7 GB)
  p05 outputSize: 14736.0 MB (14.7 GB)
  p25 outputSize: 14762.1 MB (14.7 GB)
  p50 outputSize: 14783.9 MB (14.7 GB)
  p75 outputSize: 14805.1 MB (14.8 GB)
  p95 outputSize: 14831.3 MB (14.8 GB)
  p99 outputSize: 14862.5 MB (14.8 GB)

scope-287: 400 tasks
  Total outputSize: 333020.8 MB (333.0 GB)
  Minimum outputSize: 831.8 MB (0.8 GB)
  Maximum outputSize: 833.2 MB (0.8 GB)
  p01 outputSize: 832.0 MB (0.8 GB)
  p05 outputSize: 832.1 MB (0.8 GB)
  p25 outputSize: 832.4 MB (0.8 GB)
  p50 outputSize: 832.5 MB (0.8 GB)
  p75 outputSize: 832.6 MB (0.8 GB)
  p95 outputSize: 832.9 MB (0.8 GB)
  p99 outputSize: 833.1 MB (0.8 GB)
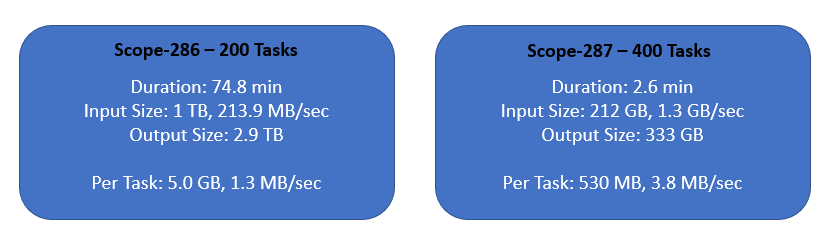
You can see that there are issues with scope-286, its task inputs are huge (5 GB per task), and the computation is intensive producing even much larger resulting data (14 GB per task).
Analyzing Reducers
Now let’s collect some statistics for reducers performing GROUP BY and JOIN in my example:
scope-288: 200 tasks
  Total shuffleSize: 333020.8 MB (333.0 GB)
  Minimum shuffleSize: 1651.6 MB (1.6 GB)
  Maximum shuffleSize: 1678.0 MB (1.6 GB)
  p01 shuffleSize: 1653.0 MB (1.6 GB)
  p05 shuffleSize: 1655.6 MB (1.6 GB)
  p25 shuffleSize: 1661.8 MB (1.6 GB)
  p50 shuffleSize: 1664.8 MB (1.6 GB)
  p75 shuffleSize: 1668.7 MB (1.6 GB)
  p95 shuffleSize: 1674.0 MB (1.6 GB)
  p99 shuffleSize: 1677.0 MB (1.6 GB)

scope-289: 200 tasks
  Total shuffleSize: 2963183.0 MB (2963.1 GB)
  Minimum shuffleSize: 14729.5 MB (14.7 GB)
  Maximum shuffleSize: 14915.0 MB (14.9 GB)
  p01 shuffleSize: 14751.9 MB (14.7 GB)
  p05 shuffleSize: 14767.8 MB (14.7 GB)
  p25 shuffleSize: 14793.7 MB (14.7 GB)
  p50 shuffleSize: 14815.6 MB (14.8 GB)
  p75 shuffleSize: 14837.0 MB (14.8 GB)
  p95 shuffleSize: 14863.1 MB (14.8 GB)
  p99 shuffleSize: 14894.4 MB (14.8 GB)
JOIN in scope-289 is well-balanced but it just has to process too large volume of data (2.9 TB) for 200 tasks.
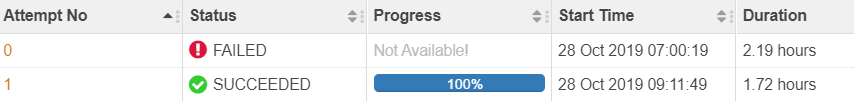
Failed Reducer Attempts
One of reduce tasks failed after more than 2 hours of execution:
2019-10-28 04:00:17,063 [INFO] |history.HistoryEventHandler|:
  [Event:TASK_STARTED]: vertexName=scope-289, taskId=task_1571947206222_4487_1_03_000101

2019-10-28 06:11:49,734 [INFO] |history.HistoryEventHandler|:
  [Event:TASK_ATTEMPT_FINISHED]: vertexName=scope-289,
  taskAttemptId=attempt_1571947206222_4487_1_03_000101_0,
  diagnostics=Error: Error while running task ( failure ) :
    java.io.IOException: Error closing multipart upload
Tez automatically started a new attempt, but this failure added 2 hours to the job execution time (!):
2019-10-28 06:11:49,735 [INFO] |impl.TaskImpl|: Scheduling new attempt for task:
  task_1571947206222_4487_1_03_000101, currentFailedAttempts: 1, maxFailedAttempts: 4

2019-10-28 07:54:44,148 [INFO] |history.HistoryEventHandler|:
  [Event:TASK_ATTEMPT_FINISHED]: vertexName=scope-289,
  taskAttemptId=attempt_1571947206222_4487_1_03_000101_1, status=SUCCEEDED
The task that could finish at 6:11 finished at 7:54 due to the failure.
Increasing Parallelism
In my environment the cluster that runs this job has 300 nodes so I increased the number tasks for JOIN and scope-286 mapper to 2,000 and job takes only 25-30 minutes to run now (instead of 3-5 hours).
Conclusion
Distributed data pipelines often have huge potential to improve their performance. DAGs can be complex and you have to monitor the performance of every vertex to find long running tasks and try to increase the parallelism.
Failure is normal in distributed environments so even if you do not have enough resources to run all tasks concurrently it is still helpful to have large number of small tasks to minimize the delays introduced by task attempt re-runs.